Boba Comparisons
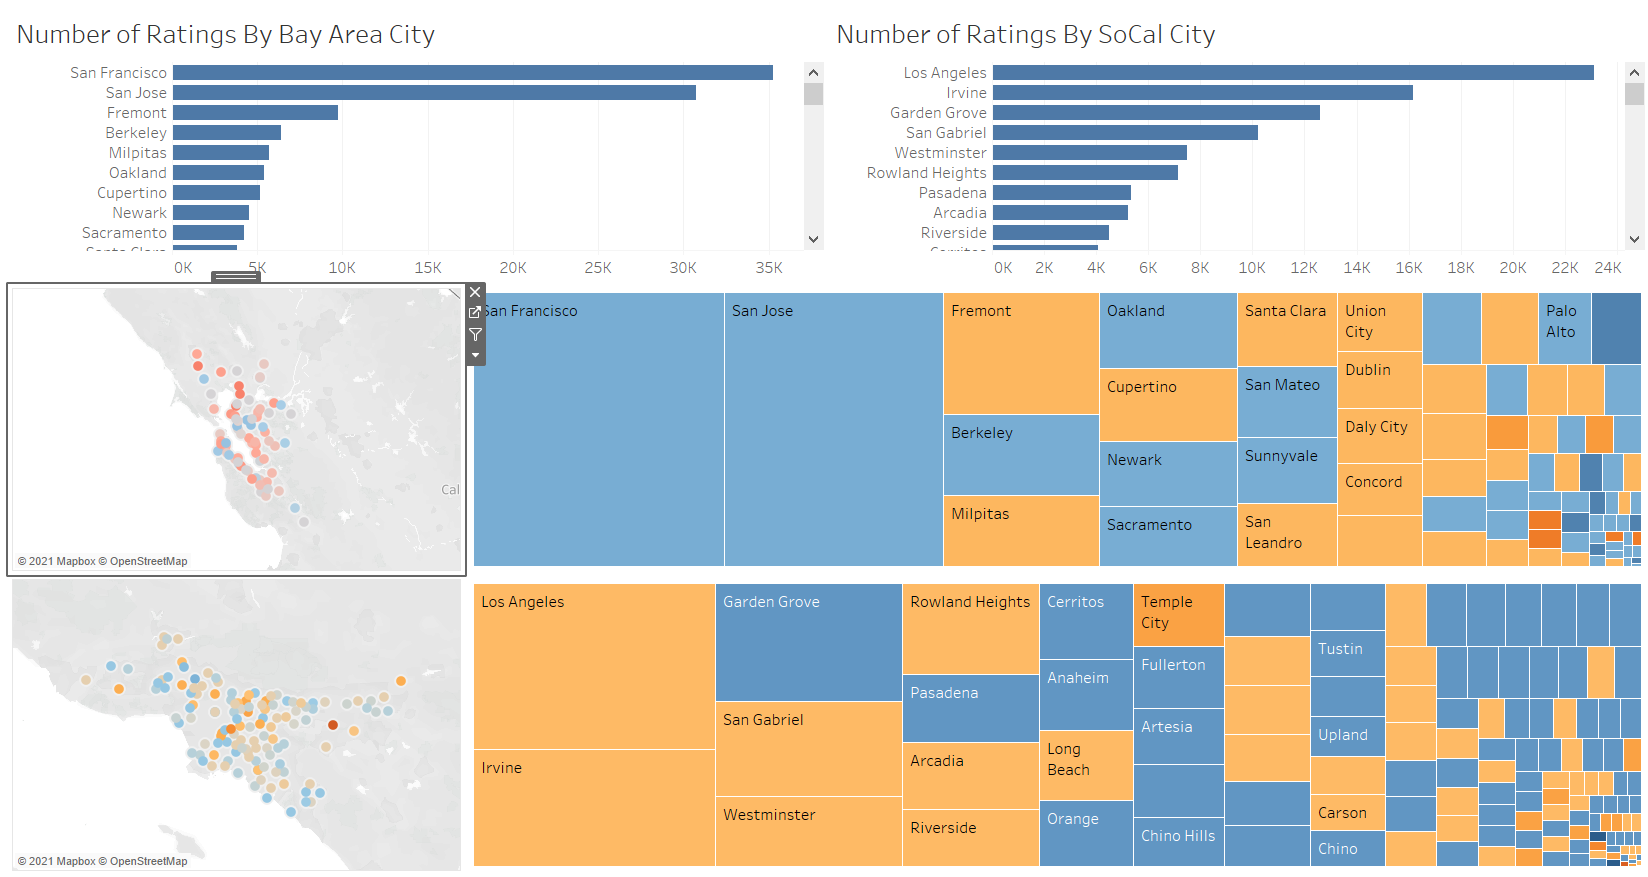
This is a pretty involved project, so I wrote two blog posts about it
here
and
here.
It is a continuation
of a prior project which used a limited dataset to analyze Bay Area boba shops, but this time
with updated data and an attempt at a Google Cloud Services data pipeline.
📺 View Live
⌨️ View Code

Chicago Bikeshare
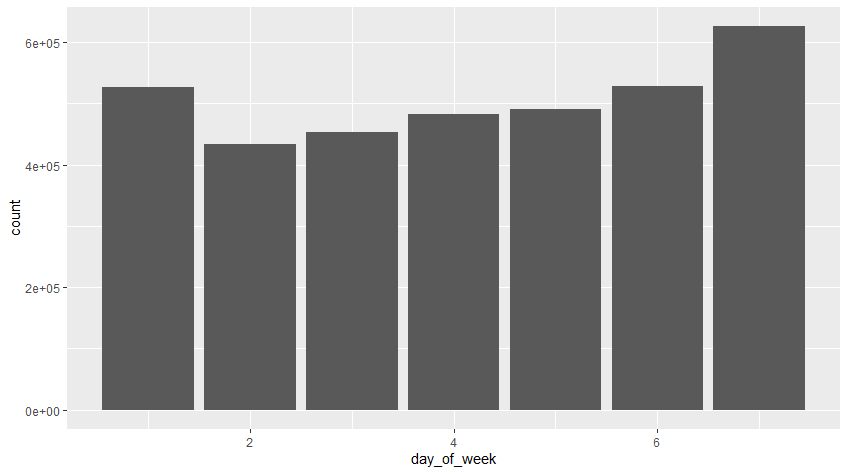
This is a case study using data from bikeshare in Chicago to determine the major differences between
casual users and members, and recommend marketing strategies to convert casual users to members. Again,
this project can be found in a blog post here.

WSB Performance
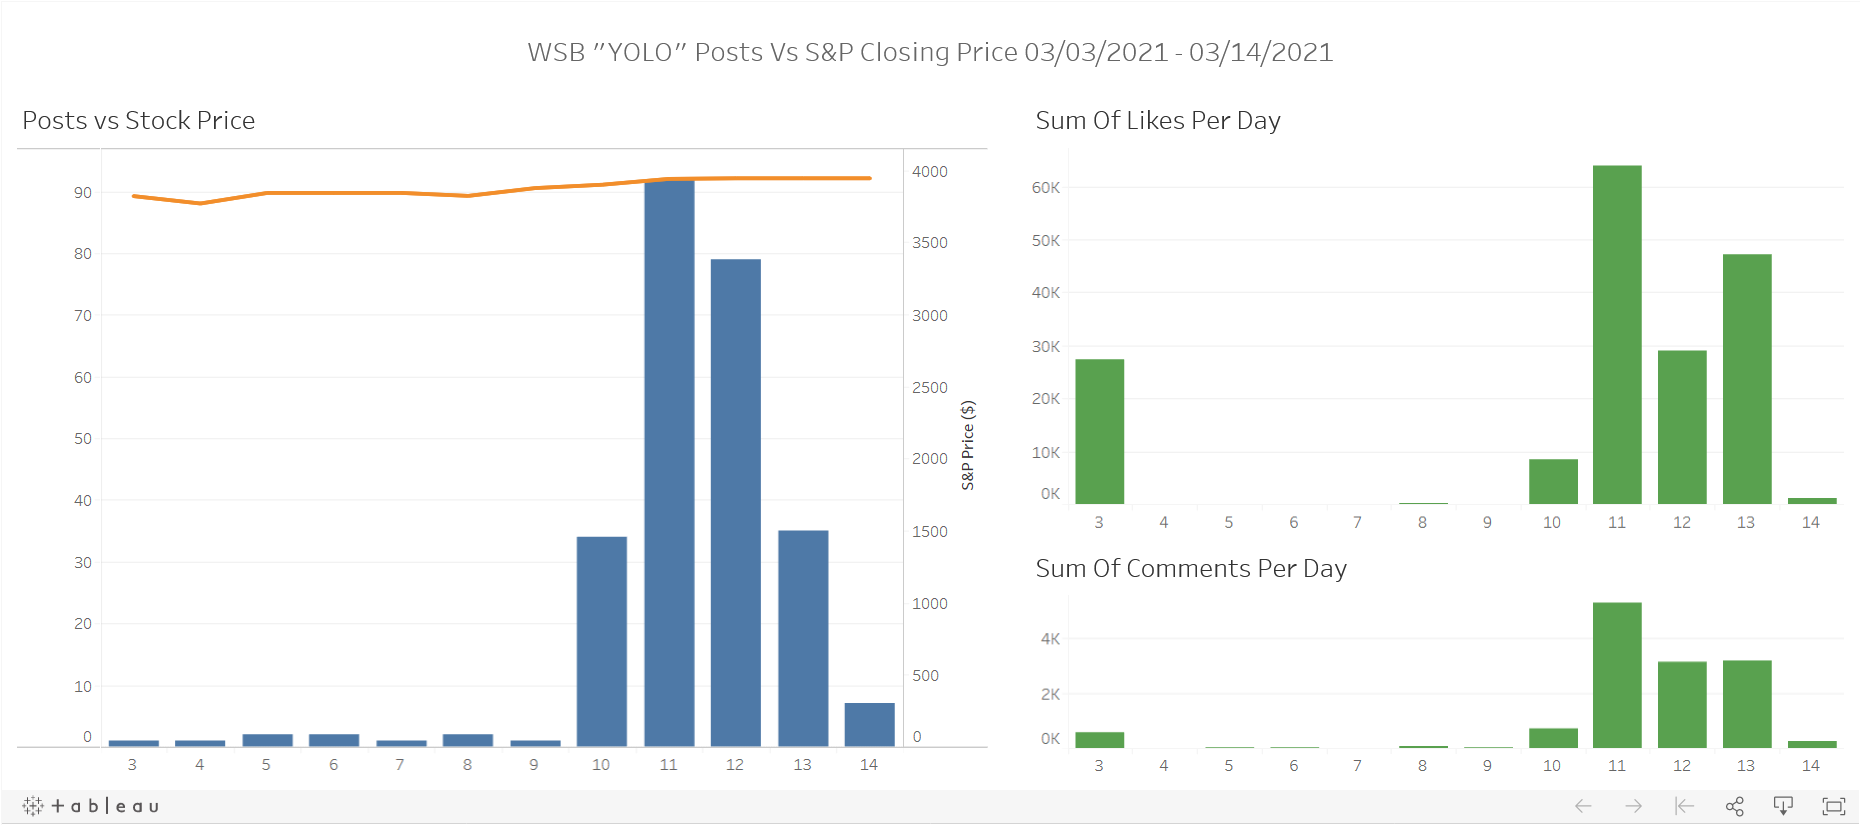
I wrote a web scraper using BeautifulSoup to pull all posts on the Wall Street Bets
Subreddit that were tagged with "YOLO" or had "YOLO" in the title. The goal was to
see if there was any sort of trend (like more "YOLOing" when the market is up). Sadly,
Reddit limits the number of posts displayed in any setting to only 1000, and they eliminated
their filter by date API, so I was only able to get 10 days' worth of data before hitting
the page limit. It still sort of answers the original question though: "YOLOing" seems
to happen entirely randomly and independent of the market.
📺 View Live


